Comparing Classifiers, Features, and Databases
This tutorial explains how to use Nkululeko’s multiple runs feature to statistically compare different experimental configurations. This is essential for determining if differences between feature sets, classifiers, or databases are statistically significant.
Overview
Since Nkululeko version 0.98, you can run experiments multiple times and compare outcomes across different configurations with statistical significance testing.
Use cases:
Compare feature extractors (OpenSMILE vs. Praat vs. wav2vec2)
Compare classifiers (SVM vs. XGBoost vs. MLP)
Compare databases or training data combinations
Key Configuration Options
Multiple Runs
Set the number of experimental runs in [EXP]:
[EXP]
runs = 10
epochs = 100
Each run uses a different random seed, producing a distribution of results.
Statistical Output
Enable detailed statistics in [EXPL]:
[EXPL]
print_stats = True
Comparison Plot
Configure what to compare in [PLOT]:
[PLOT]
runs_compare = features  # Options: 'features', 'models', 'databases'
Example: Comparing Feature Extractors
This example compares OpenSMILE, Praat, and audmodel features for emotion recognition.
Step 1: Create Base Configuration
All configurations share the same experiment name but differ in feature type.
Configuration 1: OpenSMILE (exp_emodb_compare_os.ini)
[EXP]
root = ./examples/results/
name = exp_emodb_compare
runs = 5
epochs = 50
save = True

[DATA]
databases = ['emodb']
emodb = ./data/emodb/emodb
emodb.split_strategy = speaker_split
labels = ['anger', 'happiness', 'neutral', 'sadness']
target = emotion

[FEATS]
type = ['os']
scale = standard

[MODEL]
type = mlp
layers = {'l1':64, 'l2':16}
patience = 5

[EXPL]
print_stats = True

[PLOT]
runs_compare = features
best_model = True
Configuration 2: Praat (exp_emodb_compare_praat.ini)
[FEATS]
type = ['praat']
scale = standard
(Other sections remain the same)
Configuration 3: audmodel (exp_emodb_compare_audmodel.ini)
[FEATS]
type = ['audwav2vec2']
scale = standard
(Other sections remain the same)
Step 2: Run All Configurations
# Run with OpenSMILE features
python -m nkululeko.nkululeko --config examples/exp_emodb_compare_os.ini

# Run with Praat features
python -m nkululeko.nkululeko --config examples/exp_emodb_compare_praat.ini

# Run with audmodel features
python -m nkululeko.nkululeko --config examples/exp_emodb_compare_audmodel.ini
Step 3: View Comparison Results
After running all configurations, Nkululeko generates:
A comparison plot showing distributions for each feature type
Statistical significance tests (Mann-Whitney U or t-test)
Overall and pairwise significance values
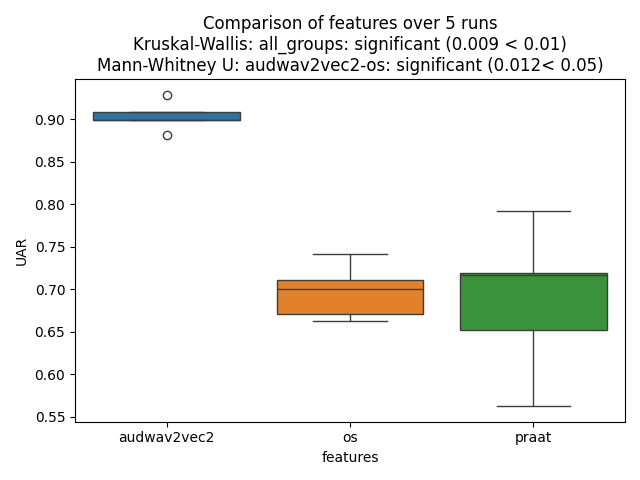
The plot shows:
Box plots or violin plots of accuracy distributions
Title with overall significance (e.g., p < 0.05)
Pairwise comparisons between configurations
Example Output Plots
Box Plot Comparison:
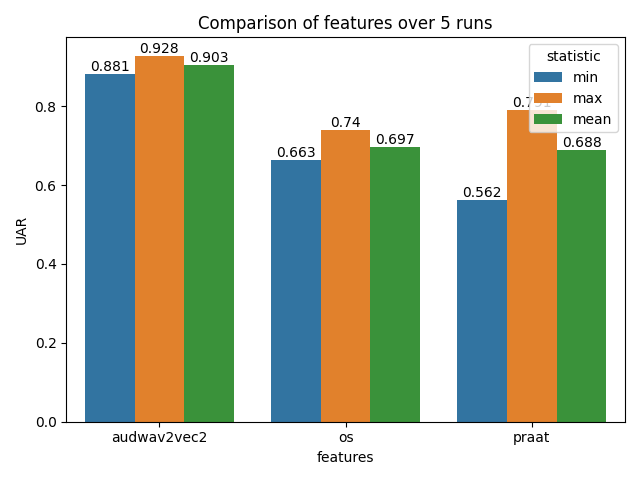
Bar Plot Comparison:
Statistical Tests
Nkululeko automatically selects the appropriate test:
Number of Runs |
Test Used |
|---|---|
≤ 30 |
Mann-Whitney U test (non-parametric) |
> 30 |
Student’s t-test (parametric) |
Comparing Different Aspects
Compare Classifiers
[PLOT]
runs_compare = models
Then run experiments with different [MODEL] type values:
type = svmtype = xgbtype = mlp
Compare Databases
[PLOT]
runs_compare = databases
Then run experiments with different database configurations.
Best Practices
Number of Runs
Purpose |
Recommended Runs |
|---|---|
Quick comparison |
5-10 |
Publication |
10-30 |
High confidence |
30+ |
More runs = more statistical power, but longer runtime.
Keep Other Variables Constant
When comparing one aspect, keep everything else the same:
Comparing features: Same model, same data, same splits
Comparing models: Same features, same data, same splits
Comparing databases: Same features, same model
Use Same Experiment Name
All configurations being compared should use the same name in [EXP]:
[EXP]
name = exp_emodb_compare  # Same for all configurations
This ensures results are collected in the same folder for comparison.
Output Files
After running multiple configurations:
results/exp_emodb_compare/
├── images/
│   └── runs_comparison.png      # Comparison plot with statistics
├── results/
│   ├── run_results_os.txt       # Results for OpenSMILE
│   ├── run_results_praat.txt    # Results for Praat
│   └── run_results_audmodel.txt # Results for audmodel
└── ...
Interpreting Results
Significance Levels
p-value |
Interpretation |
|---|---|
p < 0.001 |
Highly significant (***) |
p < 0.01 |
Very significant (**) |
p < 0.05 |
Significant (*) |
p ≥ 0.05 |
Not significant (ns) |
Example Output
The comparison plot title might show:
Overall: p=0.003** | Largest pairwise: os vs audmodel p=0.001***
This means:
Overall difference across all groups is significant (p=0.003)
The largest difference is between OpenSMILE and audmodel features
Complete Workflow Example
# 1. Compare features
python -m nkululeko.nkululeko --config examples/exp_emodb_compare_os.ini
python -m nkululeko.nkululeko --config examples/exp_emodb_compare_praat.ini
python -m nkululeko.nkululeko --config examples/exp_emodb_compare_audmodel.ini

# 2. Check the comparison plot
# Open: examples/results/exp_emodb_compare/images/runs_comparison.png
Tips
Start with fewer runs (5) for quick exploration, increase for final results
Use speaker-independent splits (
speaker_split) for realistic evaluationDocument your configurations for reproducibility
Consider computational cost: More runs × more epochs = longer runtime
Check for convergence: Ensure models have enough epochs to converge
Limitations
Statistical comparison assumes runs are independent samples
Some statisticians debate whether multiple random seeds truly represent independent samples
Consider this approach as exploratory rather than definitive proof