Feature Correlation Plots (regplot)
Overview
The regplot feature (added in Version 1.1.0 via PR #316) visualizes correlations between pairs of continuous acoustic features and optional targets. Use it to see how features relate to each other and to classification or regression targets, spot redundancy, and guide feature engineering before modeling.
What regplot does
Two- or three-element specs:
[feat_x, feat_y]or[feat_x, feat_y, target]Categorical targets: color-coded regression plots
Continuous targets: bubble plots (size + color gradient)
Pearson correlation coefficient (PCC) overlay
Optional mixed linear model statistics with
print_stats = TrueGraceful feature name suggestions on typos
Configuration
Add to the [EXPL] section of your INI file:
regplot = [[feat_1, feat_2], [feat_1, feat_2, target], ...]
Format |
Description |
|---|---|
|
Plot |
|
Plot |
Target types
Categorical (emotion, gender): per-class colors and regression lines
Continuous (age, duration): bubble plots with color + size for the target value
Examples
[EXPL]
regplot = [['duration', 'meanF0Hz']]
regplot = [['duration', 'meanF0Hz'], ['duration', 'stdevF0Hz']]
regplot = [['duration', 'meanF0Hz', 'emotion']]
regplot = [
    ['duration', 'meanF0Hz'],
    ['duration', 'meanF0Hz', 'age'],
    ['HNR', 'localJitter', 'gender']
]
Example configuration (exp_emodb_explore_features.ini)
[EXP]
root = ./examples/results/
name = exp_emodb_explore
runs = 1
epochs = 1
save = True

[DATA]
databases = ['emodb']
emodb = ./data/emodb/emodb
emodb.split_strategy = random
labels = ['angry', 'happy', 'neutral', 'sad']
emodb.mapping = {'anger':'angry', 'happiness':'happy', 'sadness':'sad', 'neutral':'neutral'}
target = emotion

[FEATS]
type = ['praat']
features = ['duration', 'meanF0Hz', 'stdevF0Hz', 'HNR', 'localJitter']

[MODEL]
type = xgb

[EXPL]
sample_selection = all
feature_distributions = all
model = ['tree', 'xgb']
max_feats = 5
# Regplot: investigate feature correlations
regplot = [['duration', 'meanF0Hz'], ['duration', 'meanF0Hz', 'age']]
scatter = ['pca']
print_stats = True
Run it:
python -m nkululeko.explore --config examples/exp_emodb_explore_features.ini
Interpreting the plots
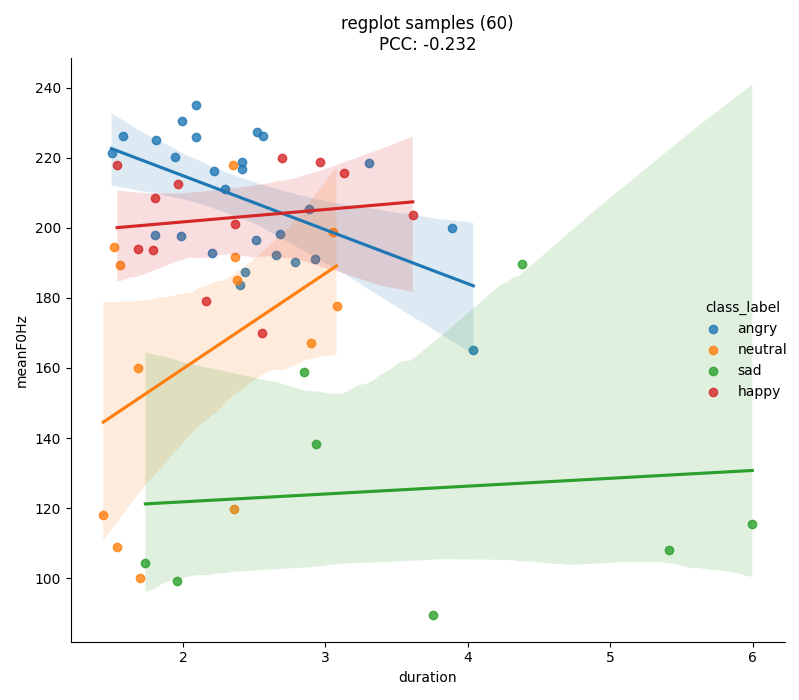
Categorical target (classification)
X-axis: first feature (e.g.,
duration)Y-axis: second feature (e.g.,
meanF0Hz)Colors: target classes (e.g., angry, happy, neutral, sad)
Regression lines: per-class trend lines
Example:
regplot = [['duration', 'meanF0Hz']]
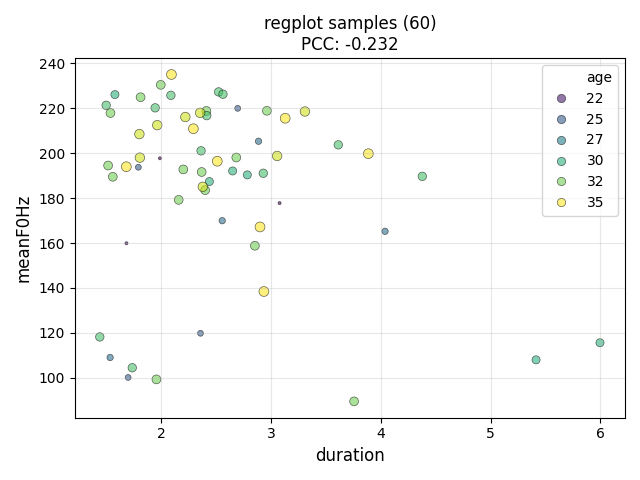
Continuous target (regression)
X-axis: first feature
Y-axis: second feature
Colors: binned target values (grouped into ranges)
Bubble size: represents target magnitude
Regression lines: per-group trend lines
Example:
regplot = [['duration', 'meanF0Hz', 'age']]
Output files
Plots are saved under results/<experiment_name>/images/ using:
regplot_<feat_x>-<feat_y>-<target>.png
Examples:
regplot_duration-meanF0Hz-class_label.pngregplot_duration-meanF0Hz-age.pngregplot_HNR-localJitter-gender.png
Advanced usage
Multiple regplots in one run
[EXPL]
regplot = [
    ['lld_mfcc3_sma3_median', 'lld_mfcc1_sma3_median'],
    ['lld_mfcc3_sma3_median', 'lld_F2frequency_sma3nz_median', 'age'],
    ['meanF0Hz', 'stdevF0Hz'],
    ['HNR', 'localJitter', 'gender']
]
Using OpenSMILE features
[FEATS]
type = ['os']
set = eGeMAPSv02

[EXPL]
regplot = [['F0semitoneFrom27.5Hz_sma3nz_amean', 'jitterLocal_sma3nz_amean'],
           ['shimmerLocaldB_sma3nz_amean', 'HNRdBACF_sma3nz_amean']]
Combine with other exploration options
[EXPL]
feature_distributions = all
scatter = ['pca', 'tsne', 'umap']
model = ['tree', 'xgb']
max_feats = 10
regplot = [['duration', 'meanF0Hz']]
print_stats = True
Statistical output (print_stats = True)
PCC for the x–y feature pair
Mixed linear model (speaker random effects) summarizing fixed effects, interactions, and variance components
Sample excerpt:
DEBUG: plots: saved regplot to .../images/regplot_duration-meanF0Hz-class_label.png
DEBUG: plots:                  Mixed Linear Model Regression Results
...
emotion[T.neutral]:meanF0Hz  0.025    0.010  2.409 0.016   0.005  0.045
Use cases
Feature selection and redundancy checks
Class separability visualization
Outlier and data quality inspection
Research insight into acoustic correlates
Tips
Start with meaningful feature pairs; lean on domain knowledge
Standardize features (
scale = standard) before plottingFor continuous targets, ensure enough samples for bubble plots
Enable
print_stats = Truewhen you want PCC and mixed-model statsBatch several pairs to compare patterns quickly
Troubleshooting
Missing feature (KeyError): check spelling; the error suggests similar column names.
Cluttered plots: downsample, filter, or use a continuous target bubble plot.
No statistics printed: set print_stats = True and install statsmodels if needed:
pip install statsmodels
Implementation notes
nkululeko/plots.py(regplot)nkululeko/feat_extract/feats_analyser.pynkululeko/utils/util.py(scale_to_range,df_to_cont_dict)nkululeko/utils/stats.py(stat tests)
References and further reading
PR #316, Issue #315
Seaborn regplot / pairplot docs
Blog: How to investigate correlations of specific features (Dec 2025)
Blog: How to plot distributions of feature values (Feb 2023)
See
ini_file.mdand other tutorials for complementary visualization techniques